
An advanced tracking system analyzes user traffic in 3D space: the paths taken, the products that attracted the most interest, and other important KPIs.
REQUEST A DEMO!Living3D uses Google Data Studio to represent data via interactive dashboards: data is easy to interpret and actionable.
What are buyers most interested in? Which points have they viewed for the longest time, and which are being ignored? Living3D provides you with behavioral insights.
Data has the potential to drive business and bring out areas for improvement. Living3D monitors the most important KPIs to provide you with insights.
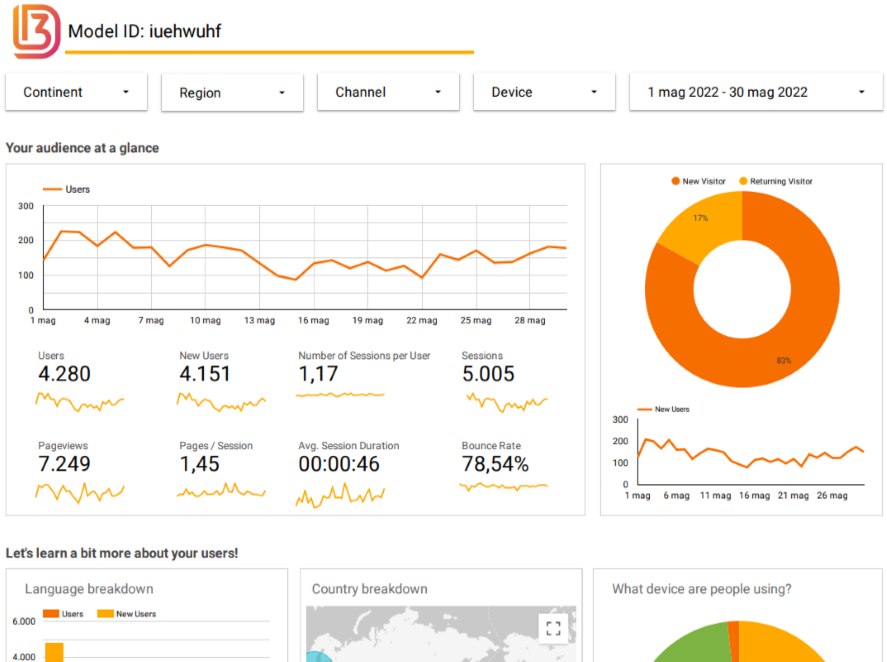
Living3D shares virtual tour data through interactive Google Data Studio Dashboards. Reports are customized to the client’s needs and can be consulted in real-time.
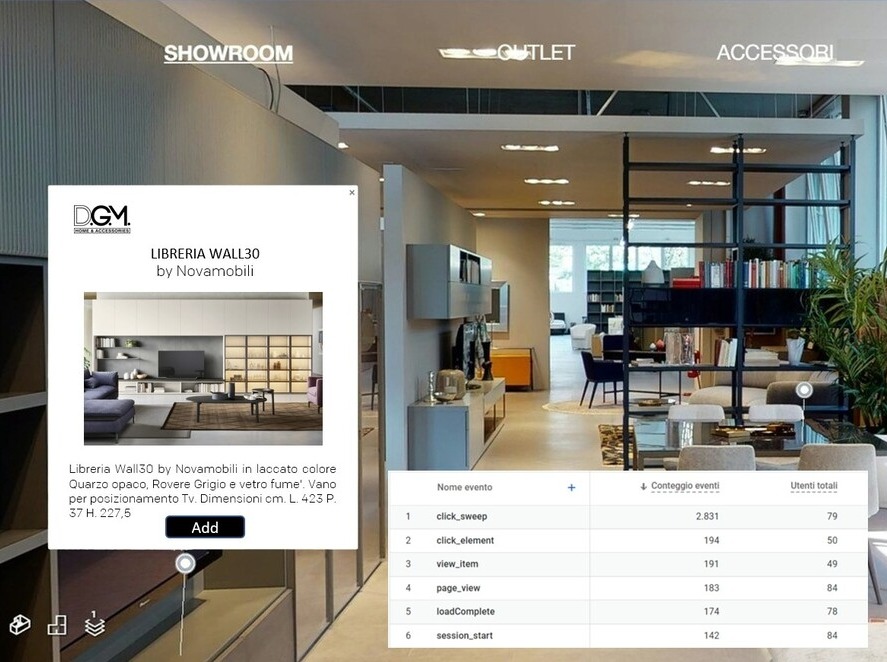
Thanks to our solution, we can track product impressions, dwell time, user interest, and the actions taken with TagL3D (e.g., click on ‘add to cart, ‘see details).
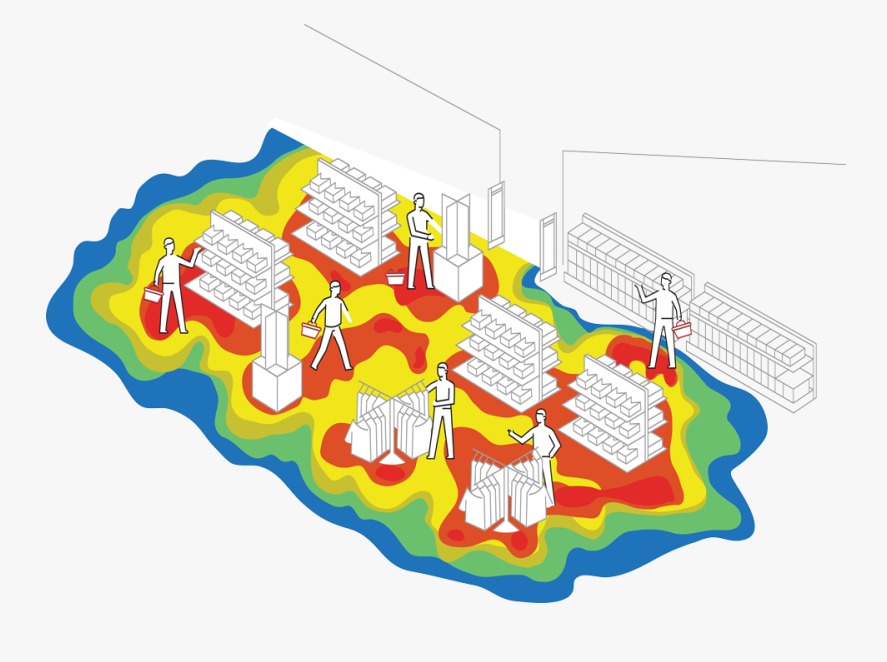
Living3D can currently track the areas of most significant interest, i.e., where the user has lingered the most in the 3D environment. Evolutive will concern with the study of common paths and the use of Google Big Query to aggregate data more quickly.

Schedule a free preliminary in-depth session to define your goals and identify the ideal solution.

Our team will assist you in identifying the KPIs to be tracked, providing an interactive dashboard to read the data.

Keep track of the users’ actions and preferences and share insights to build future strategies.
 Let's connect and create something amazing together!


